Internal Productivity Tools for Vrbo
Goal
Consolidate multiple tools and reports into a streamlined product that allows property owner support specialists to gauge their performance, prioritize their work, and review in-depth data on the accounts they manage.
Project Overview
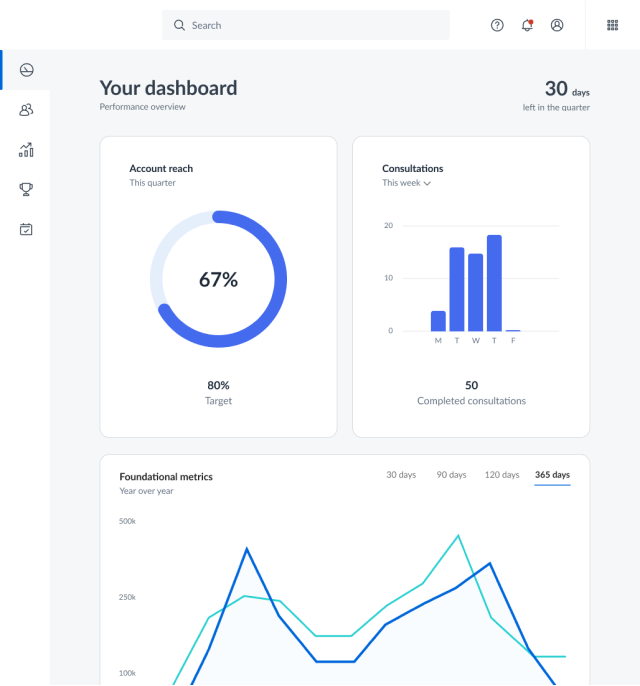
During my time at Vrbo as a Design Technologist, I primarily worked on a series of internal productivity tools, which streamlined the workflows of our property owner support specialists. These tools included dashboards to monitor various performance metrics, optimized day-to-day workflows, multi-channel insights, and more.
I worked as part of the design team to not only make these tools a reality, but to ensure they were visually appealing and provided an easy-to-use experience for our users. This included:
- Coordinating communication between design, engineering, and product
- Designing technical enterprise level tools and components with a focus on usability and making large amounts of data easy to parse
- Developing various prototypes for usability studies and to showcase desired responsive behaviors and animations within products
- Spearheading the creation and maintenance of the Atlas Design System
- Assisting with production-level code and implementation of designs
- Participating in user research and usability studies, as well as shadowing team members who used our tools
- Coaching designers on how their work will be implemented
- Mentoring engineers on CSS, markup, and accessibility best practices
- Styling third-party integrations to ensure they're cohesive with the rest of the product design
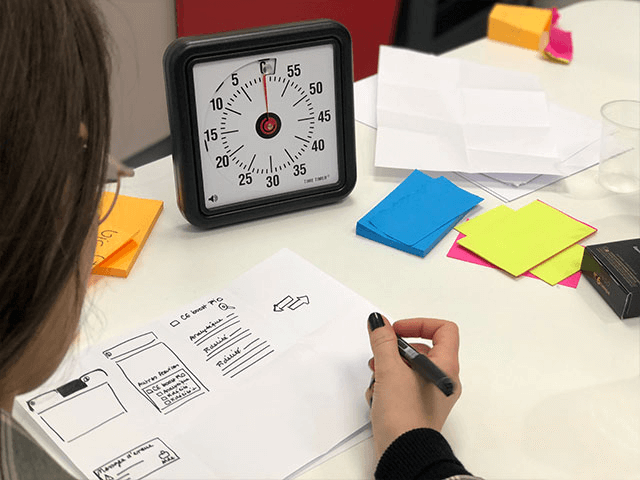
The Human Element
Because we were building tools for internal employees, we had direct access to our user base and could really gain a strong understanding of their needs, frustrations, and personal goals. Our team took the opportunity to meet with our users in-person and shadow them throughout their work days. This led to a number of great insights that we were then able to take back to the product and incorporate into the user experience.
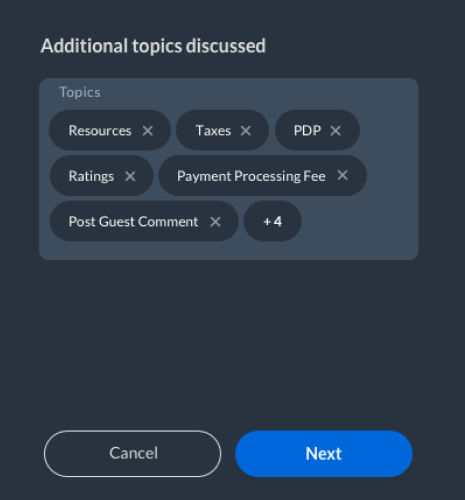
Interaction Design & Prototyping
As part of my role as a Design Technologist, I was also responsible for interaction design and creating working prototypes with HTML, CSS, and JavaScript. These prototypes were used for usability studies, as well as providing a starting point for React developers to integrate into the app. Here are a few examples:
- Product comparison table: Interaction example, HTML prototype
- Search bar interaction: Interaction example, HTML prototype
Outcome
Prior to the launch of our tool, property owner support specialists had to sift through a slew of tools and reports to gauge their performance and decide what partners they were going to reach out to. Our work consolidated that into a single tool that leveraged multiple data science models to help users prioritize and streamline their work. We received overwhelmingly positive reviews from our users, along with plenty of feature requests and interest from other internal teams about creating their own tools.
If you'd like to see more of this work, send me an email. You can also check out the Atlas Design System case study for more details on the design system and components I created for these internal tools.